Main features of Microsoft Power BI
When you open the Power BI service, you’ll see a dashboard displayed. Dashboards are something that differentiates Power BI service from Power BI Desktop.

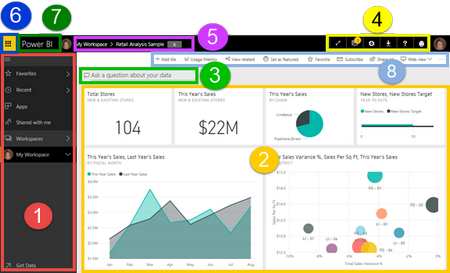
The main features of your Power BI service UI are the following:
navigation pane (left nav)
canvas (in this case, dashboard with tiles)
Q&A question box
icon buttons, including help and feedback
dashboard title (navigation path, aka breadcrumbs)
Office 365 app launcher
Power BI home button
Labeled icon buttons
Power BI concepts
The 4 major building blocks of Power BI are: dashboards, reports, workbooks, and datasets. And they’re all organized into workspaces. It’s important to understand workspaces before we dig into the 4 building blocks, so let’s start there.
Workspaces
Workspaces are containers for dashboards, reports, workbooks, and datasets in Power BI. There are two types of workspaces: *My workspace and app workspaces. So what is an app? A Power BI app is a collection of dashboards and reports built to deliver key metrics for your organization. Apps are interactive but can’t be edited
Datasets
A dataset is a collection of data that you import or connect to. Power BI lets you connect to and import all sorts of datasets and bring all of it together in one place.
Datasets are associated with workspaces and a single dataset can be part of many workspaces. When you open a workspace, the associated datasets are listed under the Datasets tab. Each listed dataset represents a single source of data, for example, an Excel workbook on OneDrive, or an on-premises SSAS tabular dataset, or a Salesforce dataset. There are many different data sources supported, and we’re adding new ones all the time. See the list of dataset types that can be used with Power BI.
Reports
A Power BI report is one or more pages of visualizations (charts and graphs like line charts, pie charts, treemaps, and many many more). Visualizations are also called visuals. All of the visualizations in a report come from a single dataset. Reports can be created from scratch within Power BI, can be imported with dashboards that colleagues share with you, or can be created when you connect to datasets from Excel, Power BI Desktop, databases, SaaS applications and apps. For example, when you connect to an Excel workbook that contains Power View sheets, Power BI creates a report based on those sheets. And when you connect to an SaaS application, Power BI imports a pre-built report.
Dashboards
A dashboard is something you create in Power BI service or something a colleague creates in Power BI service and shares with you. It is a single canvas that contains zero or more tiles and widgets. Each tile pinned from a report or from Q&A displays a single visualization that was created from a dataset and pinned to the dashboard. Entire report pages can also be pinned to a dashboard as a single tile. There are many ways to add tiles to your dashboard; too many to be covered in this overview topic. To learn more, see Dashboard tiles in Power BI.
Why do people create dashboards? Here are just some of the reasons:
- to see, in one glance, all the information needed to make decisionsto monitor the most-important information about your business
- to ensure all colleagues are on the same page, viewing and using the same information
- to monitor the health of a business or product or business unit or marketing campaign, etc.
- to create a personalized view of a larger dashboard — all the metrics that matter to you